As a teacher, I often get presented with this question- “Do I really need to do my homework?”. My answers usually range depending on the age of the student and my varying desire to engage in a long, drawn-out debate on the matter, which usually ends with an aggrieved acceptance from both sides. What isn’t arguable is that the PISA 2022 dataset significantly places Singapore at the top. Singapore scores the highest PV (plausible value) overall score (1679), which is accumulated by adding together the Math, Reading and Science scores across the country. Not only does Singapore score the highest cumulative score, it scores the highest in each of the three individual PV scores: highest in Maths, highest in Science and highest in Reading. The closest challenger is China, which has a total score of 1605, and the closest European country is Estonia, which sits in 7th overall with a total score of 1547. The UK sit in 14th place, the US in 18th place, and Australia in 11th place in the overall standings (OECD 2022).
# load librarieslibrary(arrow)library(tidyverse)#link to PISA 2022 DataPISA_2022 <-read_parquet("/Users/k1765032/Library/CloudStorage/OneDrive-King'sCollegeLondon/QERKCL_PISA/data/pisa/2022/PISA_student_2022.parquet")# Filter dataset and categorise home study percentagesplot_data <- PISA_2022 %>%select(CNT,PV1MATH, STUDYHMW) %>%filter(CNT =="Singapore"| CNT =="United Kingdom"| CNT =="United States"|CNT =="Australia") %>%mutate(Homework_TPW =case_when( STUDYHMW %in%c("No studying") ~"None", STUDYHMW %in%c("1 time of studying per week", "2 times of studying per week", "3 times of studying per week", "4 times of studying per week") ~"1-4 Per Week", STUDYHMW %in%c("5 times of studying per week","6 times of studying per week", "7 times of studying per week", "8 times of studying per week") ~"5-8 Per Week", )) %>%filter(!is.na(Homework_TPW)) %>%group_by(CNT, Homework_TPW) %>%summarise(count =n()) %>%mutate(perc =round(count/sum(count) *100, digits =0))#Plotting ggplot(data = plot_data, aes(x = Homework_TPW, y= perc, fill = CNT)) +geom_bar(position =position_dodge(), stat ="identity") +geom_text(stat ='identity', aes(label =paste(perc, "%")), position =position_dodge(width =0.9), vjust =-0.5, size =2) +theme(axis.text.x =element_text(angle =0, vjust =0.5, hjust=1),text =element_text(family ="Times New Roman"), # Change font familyplot.title =element_text(size =18, face ="bold", hjust =0.5), # Title styleplot.subtitle =element_text(size =14, hjust =0.5, color ="gray40"), # Subtitle styleaxis.title =element_text(size =12, face ="bold"), # Axis labelsaxis.text =element_text(size =10), # Tick labelslegend.title =element_text(size =12, face ="bold"), # Legend titlelegend.text =element_text(size =10) # Legend text ) +scale_fill_manual(values =c("United Kingdom"="#D4AC0D" , "Singapore"="#003366", "United States"="#800020", "Australia"="#556B2F" )) +labs(x="Number of Home Studying Sessions Per Week", y="Percentage %", title ="A Comparison of Home Studying Sessions -\n UK, US, Australia and Singapore", fill ="Country")
Conclusions
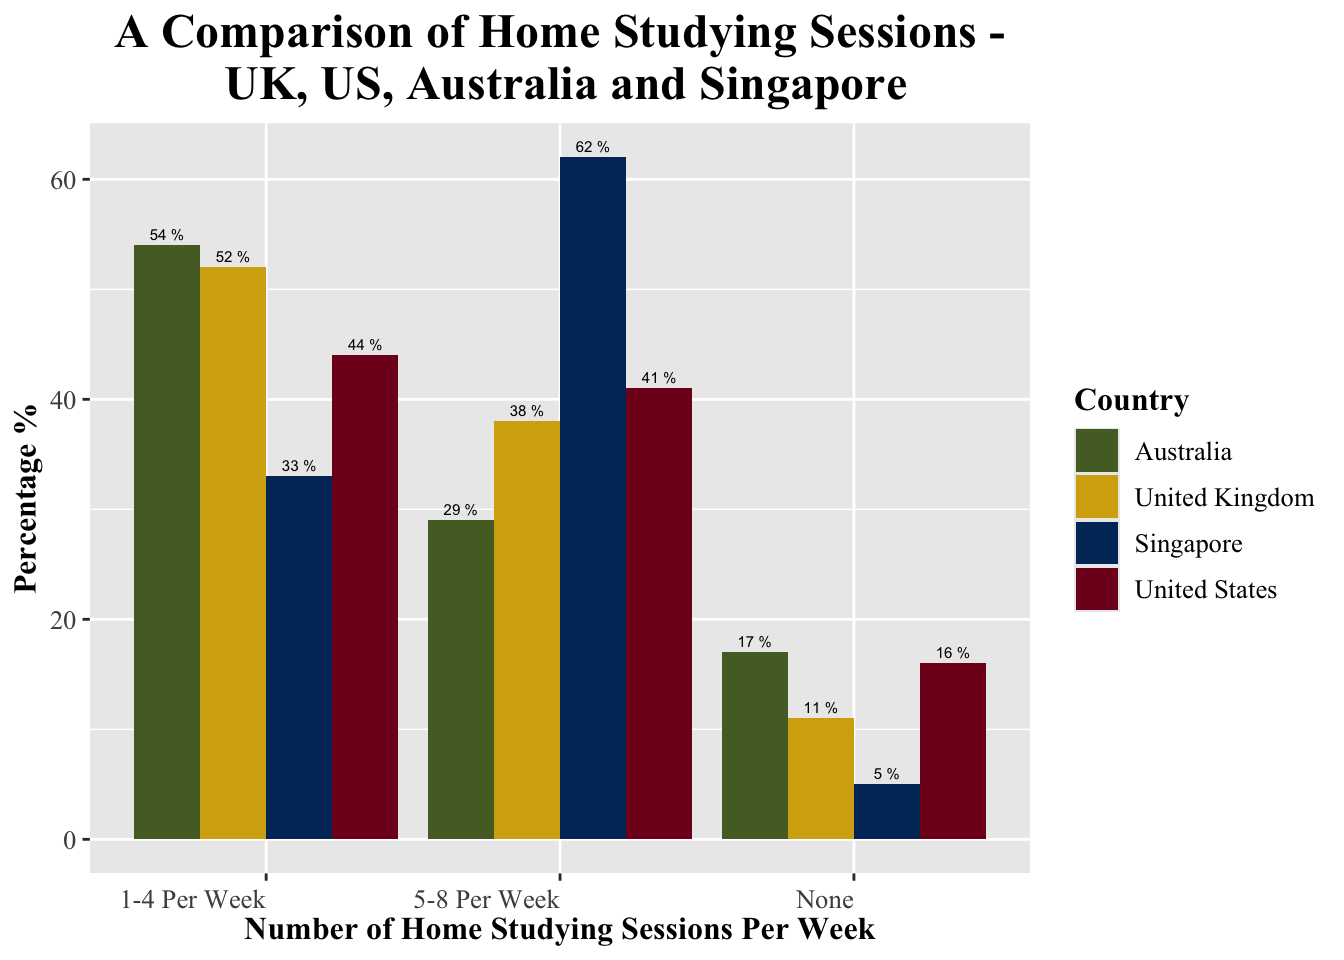
The bar chart shows that Singapore has the lowest percentage of students completing either ‘None’ or ‘1-4’ home study sessions per week. What is of note is that both Australia and the United States have nearly 20% of all participants completing no home study sessions per week. The United Kingdom also shows a percentage that is double the percentage of students in Singapore that do no home study sessions.
If I then take a look at the category 5-8 sessions a week, we will see a reverse of these trends. The percentage of Singapore students who completed 5-8 sessions of home study a week is much higher than that of comparable countries. We can see that 62% of all students complete between 5-8 sessions of home studying per week. We see a mean average of 36.4% of students who completed 5-8 sessions of home study per week between Australia, the United States, and the United Kingdom. A significant numerical difference.
Therefore, we could reasonably conclude that Singapore students do significantly more home studying than comparable students in the United States, United Kingdom, and Australia. Does this correlate to the high scores in Reading, Maths, and Science? Will this make you think differently the next time a student asks, “Do I really need to do my homework?” I think it will for me.