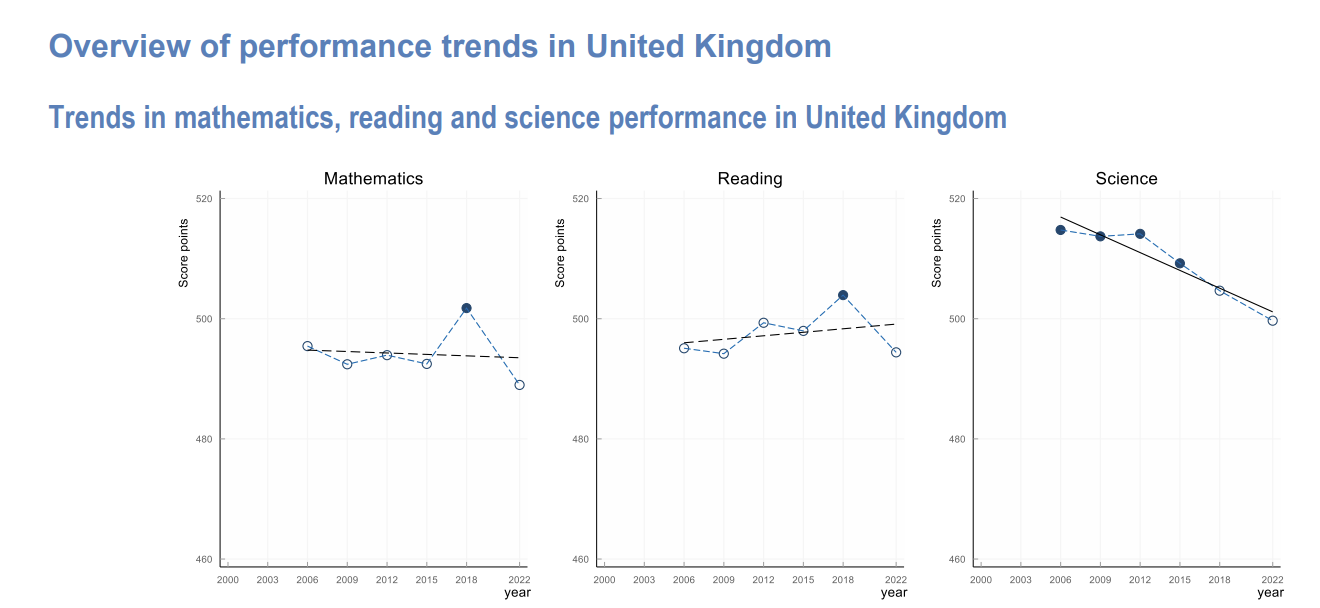
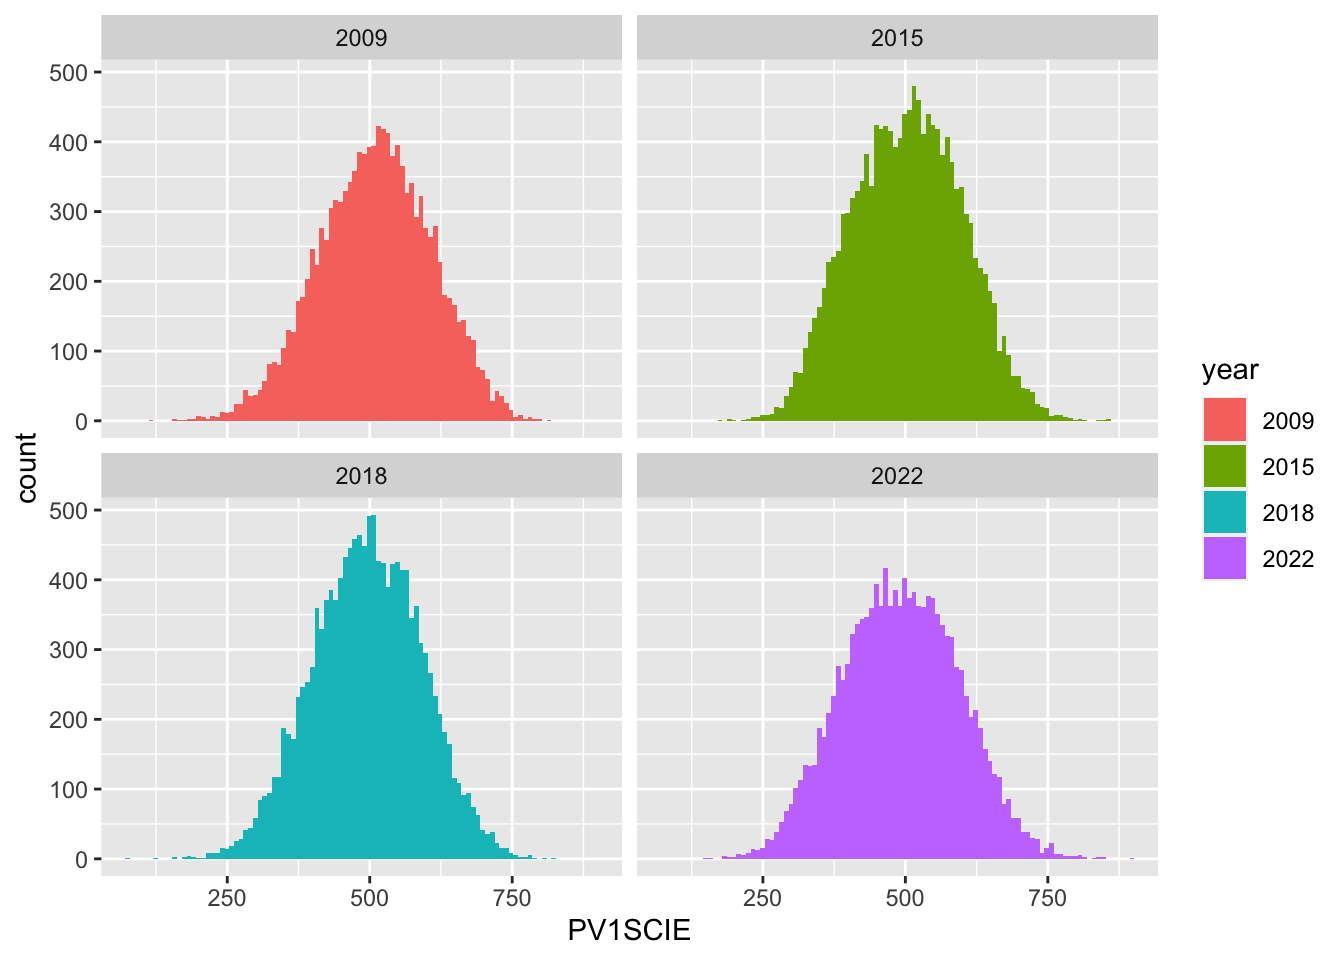
I wanted to know whether this trend was statistically significant. So I set about completing an anova test. This was using PISA data from 2009, 2015, 2018, and 2022.
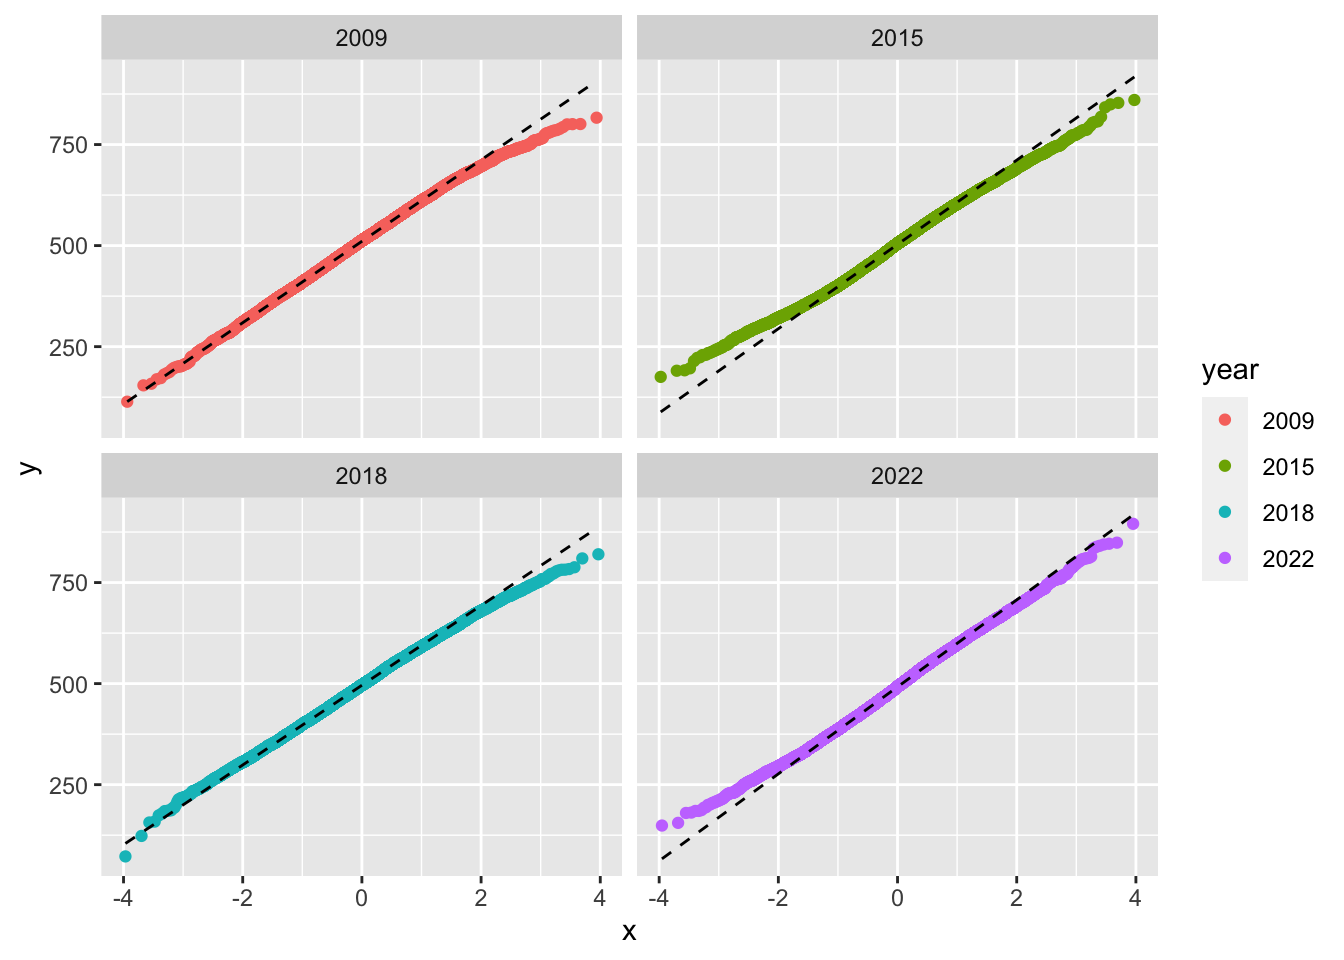
First, I checked that the data was normally distributed. For all four data sets this was shown to be true.
The variance ratio was close to 1, for all pairs, so the two conditions were met and so I could then perform the anova test.
The null hypothesis would be that the mean of PV1SCIE for all the years would be the same, with the alternative hypothesis being statically different.
Since I had 4 sets of PISA data, this meant that I wanted to perform multiple t-tests, so therefore I completed an anova test.
Anova test
result <-aov(data =TotalPISA, PV1SCIE ~ year) sumanova <-summary(result) sumanova
               Df    Sum Sq Mean Sq F value Pr(>F)
year            3   2511892  837297    87.4 <2e-16 ***
Residuals   53122 508920819    9580
---
Signif. codes:  0 '***' 0.001 '**' 0.01 '*' 0.05 '.' 0.1 ' ' 1
The Pr(>F) value is <2e-16 which is over 0.05. This suggests that the PV1SCIE values are statistically different.
My question is: Why is it that there is a difference in the PV1SCIE scores. Why are they going down? What are the factors that could be causing this?
To further look at the results I ran a Tukey Test following on from the Anova. A Tukey Test can be used to determine which years have significant differences, in this case the mean PV1SCIE scores in the UK.
Interestingly, we cannot say there is a statistical difference between 2022 and 2018, since the p value is larger than 0.05. All other comparisons are statistically difference. Therefore I would agree with OECD (OECD 2023a) that the decline of Science values are not all down to the pandemic. There must be other factors for the decrease in science values. It would be interesting to investigate what is causing this pattern.