This post looks into the differences between mother’s and father’s education levels across the world. Do mothers or fathers have higher education levels. Do people tend to partner up with people who have a similar education level to themselves?
PISA use the ISCED international educational comparison system (OECD 2011). PISA only ask about the first 4 education levels though, 0,1,2 and 3. The highest level, level 3, corresponds to having completed the country’s equivalent of high school. PISA split the level 3 grouping into 3.3 and 3.4. which relate to vocational and non-vocational education types both at high school level (OECD 2022).
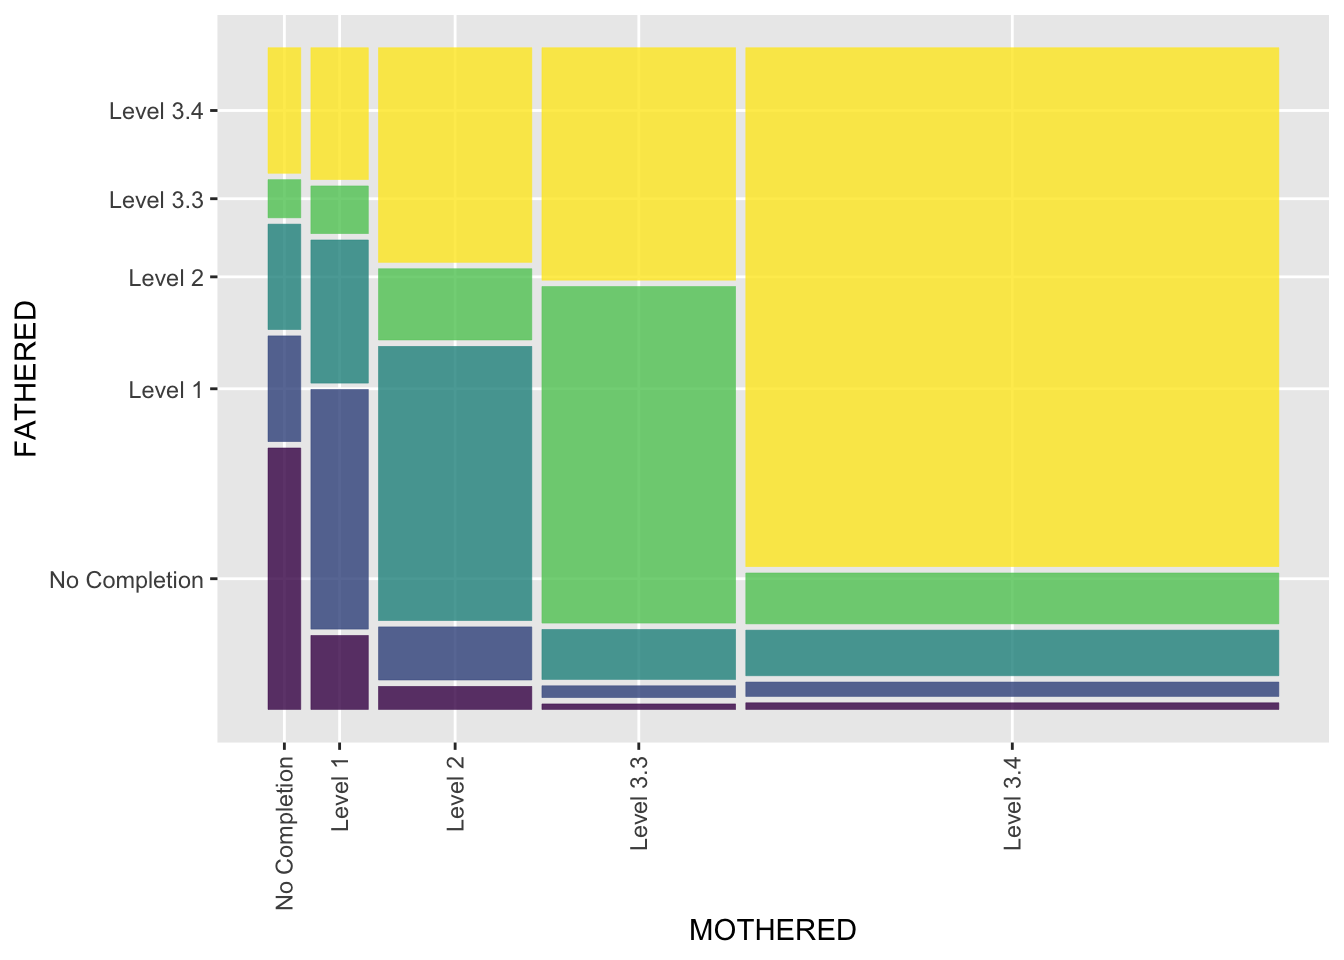
First let’s investigate the world distribution of education levels and answer our two questions about the world as a whole.
So on average pupils’ fathers’ distribution of level of education is generally higher than their mothers’ distribution however the largest groupings are for situations where the father’s and mother’s education is the same. So worldwide we have a visible education inequality between women and men, but also we have the interesting finding that people tend to partner up with those that have similar education levels to themselves.
Given the highest level measured is high school this seems to make sense, it is easy to imagine people meeting each other and creating their social networks in school, leaving school early together or staying in school for longer together and then eventually pairing up with people from those exact social networks, at least that’s my hypothesis, further investigation would be needed; perhaps PISA could include a question on their next parental survey: “sooooo, how’d you two meet??”
The mosaic plot does make the distributions look significantly different, but let’s test for significance anyway and see just how significant the finding is.
p = 2.2e-16 which is far less than 0.05 so the result is statistically significant, however the level of education variable is ordinal, Chi-Square will work on ordinal data but a Kruskal Wallis test is arguably more appropriate as it takes into account the ordinal nature of the data.
kruskal.test(data = c5, MOTHERED ~ FATHERED)
    Kruskal-Wallis rank sum test

data:  MOTHERED by FATHERED
Kruskal-Wallis chi-squared = 158276, df = 4, p-value < 2.2e-16
p-value = 2.2e-16 which again is far less than 0.05 so the result is statistically significant. This means mothers’ and fathers’ distributions of education level are not equal there is a significant variance between education levels.
Extension - Analysis By Country
Having looked at the world data, an obvious interesting question is: Which countries are most equal? Are there any countries in which mothers have greater education levels than fathers on average? To do this I first have to convert the ISCED data into numeric levels so “Level 3.4” becomes simply the number 3. Then for each pupil I subtract the mother’s education level from the father’s education level to get a difference in education, with zero meaning no difference, a positive number meaning the father has a higher education level than the mother, and a negative number meaning the mother has a higher education level than the father. I then group by country and get the country mean for each country. I then print out every 4th country including the first and last country in the ordered list.
levels(c5$MOTHERED) <-c(3, 3, 2, 1, 0)levels(c5$FATHERED) <-c(3, 3, 2, 1, 0)c5_means<-c5 %>%mutate(MOTHERED_numeric =as.numeric(as.character(MOTHERED))) %>%mutate(FATHERED_numeric =as.numeric(as.character(FATHERED))) %>%mutate(parent_diff = FATHERED_numeric - MOTHERED_numeric) %>%group_by(CNT) %>%summarise(mean_diff =mean(parent_diff)) %>%arrange(mean_diff)rows_to_print <-seq(1, 79, by =4)if (!79%in% rows_to_print) { rows_to_print <-c(rows_to_print, 79)}selected_rows <- c5_means[rows_to_print, ]#print(selected_rows, n = 100)# To make a nice looking tableselected_rows %>%gt() %>%fmt_number(mean_diff, decimals=4) %>%tab_header(title ="Country Equality, Small Selection",subtitle ="Countries with better educated mothers have negative values, countries with better educated fathers have positive values." ) %>%cols_label(CNT ="Country",mean_diff ="Parental Education Difference",# add more columns as needed )
Country Equality, Small Selection
Countries with better educated mothers have negative values, countries with better educated fathers have positive values.
Country
Parental Education Difference
Türkiye
−0.3976
Cambodia
−0.1981
Qatar
−0.1418
Viet Nam
−0.0689
Kazakhstan
−0.0225
Montenegro
0.0102
Austria
0.0229
Brunei Darussalam
0.0355
United States
0.0528
Thailand
0.0657
Republic of Moldova
0.0845
Palestinian Authority
0.0956
Greece
0.1146
Latvia
0.1303
Mongolia
0.1556
Australia
0.1661
Italy
0.1724
Ukrainian regions (18 of 27)
0.2008
Spain
0.2310
Uruguay
0.2577
Portugal
0.2982
Conclusion
I find this quite surprising. If you had asked me before conducting my analysis “which country has the most significant educational disparity where fathers are more educated than mothers?” I wouldn’t have guessed Portugal. Yet, my findings show that, Portugal exhibits the largest gap in favour of fathers’ educational attainment, however Portugal scores highly in the world economic forum’s measure of gender equality, WEF GGGI (WEF 2024).
Turkey having the greatest educational attainment gap in favour of mothers is also surprising and perhaps works against our preconceptions related to gender equality particularly given it is a fairly low scoring country on the WEF GGGI. In fact, if you had asked me “which country has the most educational disparity where mothers are more educated than fathers?” before me doing the analysis I would have almost certainly have said one of the Scandinavian countries would have the greatest equality between father’s and mother’s educational levels in. However, Norway, Sweden, Denmark and Finland all appear well above the median value indicating a less equitable situation than you might guess in fact Iceland which has been in first place for 12 years on the WEF GGGI comes in at 8th worst using this metric. Countries that sometimes face criticism for their lack of equality for women actually score well on this metric, Turkey in 1st place, Morocco in 3rd place, Saudi Arabia in 6th place and Qatar in 9th place for having higher educational outcomes than fathers. I am not sure exactly what to take from this. Perhaps that my metric is not a good one for measuring equality, or provides a narrow view of equality as it compares mothers and fathers rather than women and men. What can be said though is that equality is a multi-faceted issue and one that we must all keep working on and must be wary of viewing it through a purely westernised lens.
Appendix
All Country’s Scores
levels(c5$MOTHERED) <-c(3, 3, 2, 1, 0)levels(c5$FATHERED) <-c(3, 3, 2, 1, 0)c5_means<-c5 %>%mutate(MOTHERED_numeric =as.numeric(as.character(MOTHERED))) %>%mutate(FATHERED_numeric =as.numeric(as.character(FATHERED))) %>%mutate(parent_diff = FATHERED_numeric - MOTHERED_numeric) %>%group_by(CNT) %>%summarise(mean_diff =mean(parent_diff)) %>%arrange(mean_diff)rows_to_print <-seq(1, 79, by =1)if (!79%in% rows_to_print) { rows_to_print <-c(rows_to_print, 79)}selected_rows <- c5_means[rows_to_print, ]#print(selected_rows, n = 100)# To make a nice looking tableselected_rows %>%gt() %>%fmt_number(mean_diff, decimals=4) %>%tab_header(title ="Country Equality, Full Selection",subtitle ="Countries with better educated mothers have negative values, countries with better educated fathers have positive values." ) %>%cols_label(CNT ="Country",mean_diff ="Parental Education Difference",# add more columns as needed )
Country Equality, Full Selection
Countries with better educated mothers have negative values, countries with better educated fathers have positive values.