Does Hard Work Always Pay Off? Exploring Maths Achievement
As teachers, we say it all the time: perseverance pays off. Yet country-level data on maths achievement and reported effort , drawn from PISA 2022 (OECD 2022), tells a more complicated story. Wealthier countries (measured using HOMEPOS) generally perform above the trend line, while poorer countries fall below it, regardless of how much effort students report. In fact, the regression line shows a downward trend, suggesting that higher reported effort doesn’t always align with higher achievement. This is particularly evident in some Eastern countries, where self-reported effort and persistence levels were among the lowest, yet their scores were some of the best. Singapore stands out as an outlier, reporting higher than average effort and achieving the very top scores. Vietnam also performs above the regression line despite being lower on the wealth index, with students reporting the highest effort of all.
suppressPackageStartupMessages({
  library(tidyverse)
  library(arrow)
  library(ggpubr)
  library(ggplot2)
  library(ggrepel)
  library(knitr)

})

opts_chunk$set(message = FALSE, warning = FALSE)


PISA_2022 <- read_parquet("/Users/k1765032/Library/CloudStorage/OneDrive-King'sCollegeLondon/QERKCL_PISA/data/pisa/2022/PISA_student_2022.parquet")

pisa_country <- PISA_2022 %>%
  group_by(CNT) %>%
  summarise(
    maths_mean = mean(PV1MATH, na.rm = TRUE),
    effort_mean = mean(MATHPERS, na.rm = TRUE),
    homepos_mean = mean(HOMEPOS, na.rm = TRUE)
  )

ggplot(pisa_country,
       aes(x = effort_mean,
           y = maths_mean,
           colour = homepos_mean)) +
  geom_point(size = 2, alpha = 0.85) +
  geom_smooth(method = "lm",
              se = FALSE,
              colour = "black",
              linewidth = 0.6) +
  geom_text_repel(
    aes(label = CNT),
    size = 2.0,
    max.overlaps = Inf,
    box.padding = 0.5,
    point.padding = 0.4,
    show.legend = FALSE
  ) +
  scale_colour_viridis_c(
    option = "viridis",
    name = "Mean HOMEPOS", direction = -1, begin = 0, end = 0.8
  ) +
  labs(
    x = "Mean student effort / persistence",
    y = "Mean mathematics score",
    title = "Effort, persistence and mathematics achievement across countries",
    subtitle = "Country-level means; colour indicates material\nhome resources (HOMEPOS)"
  ) +
  theme_minimal(base_size = 14) +
  theme(
    plot.title = element_text(face = "bold"),
    legend.position = "right")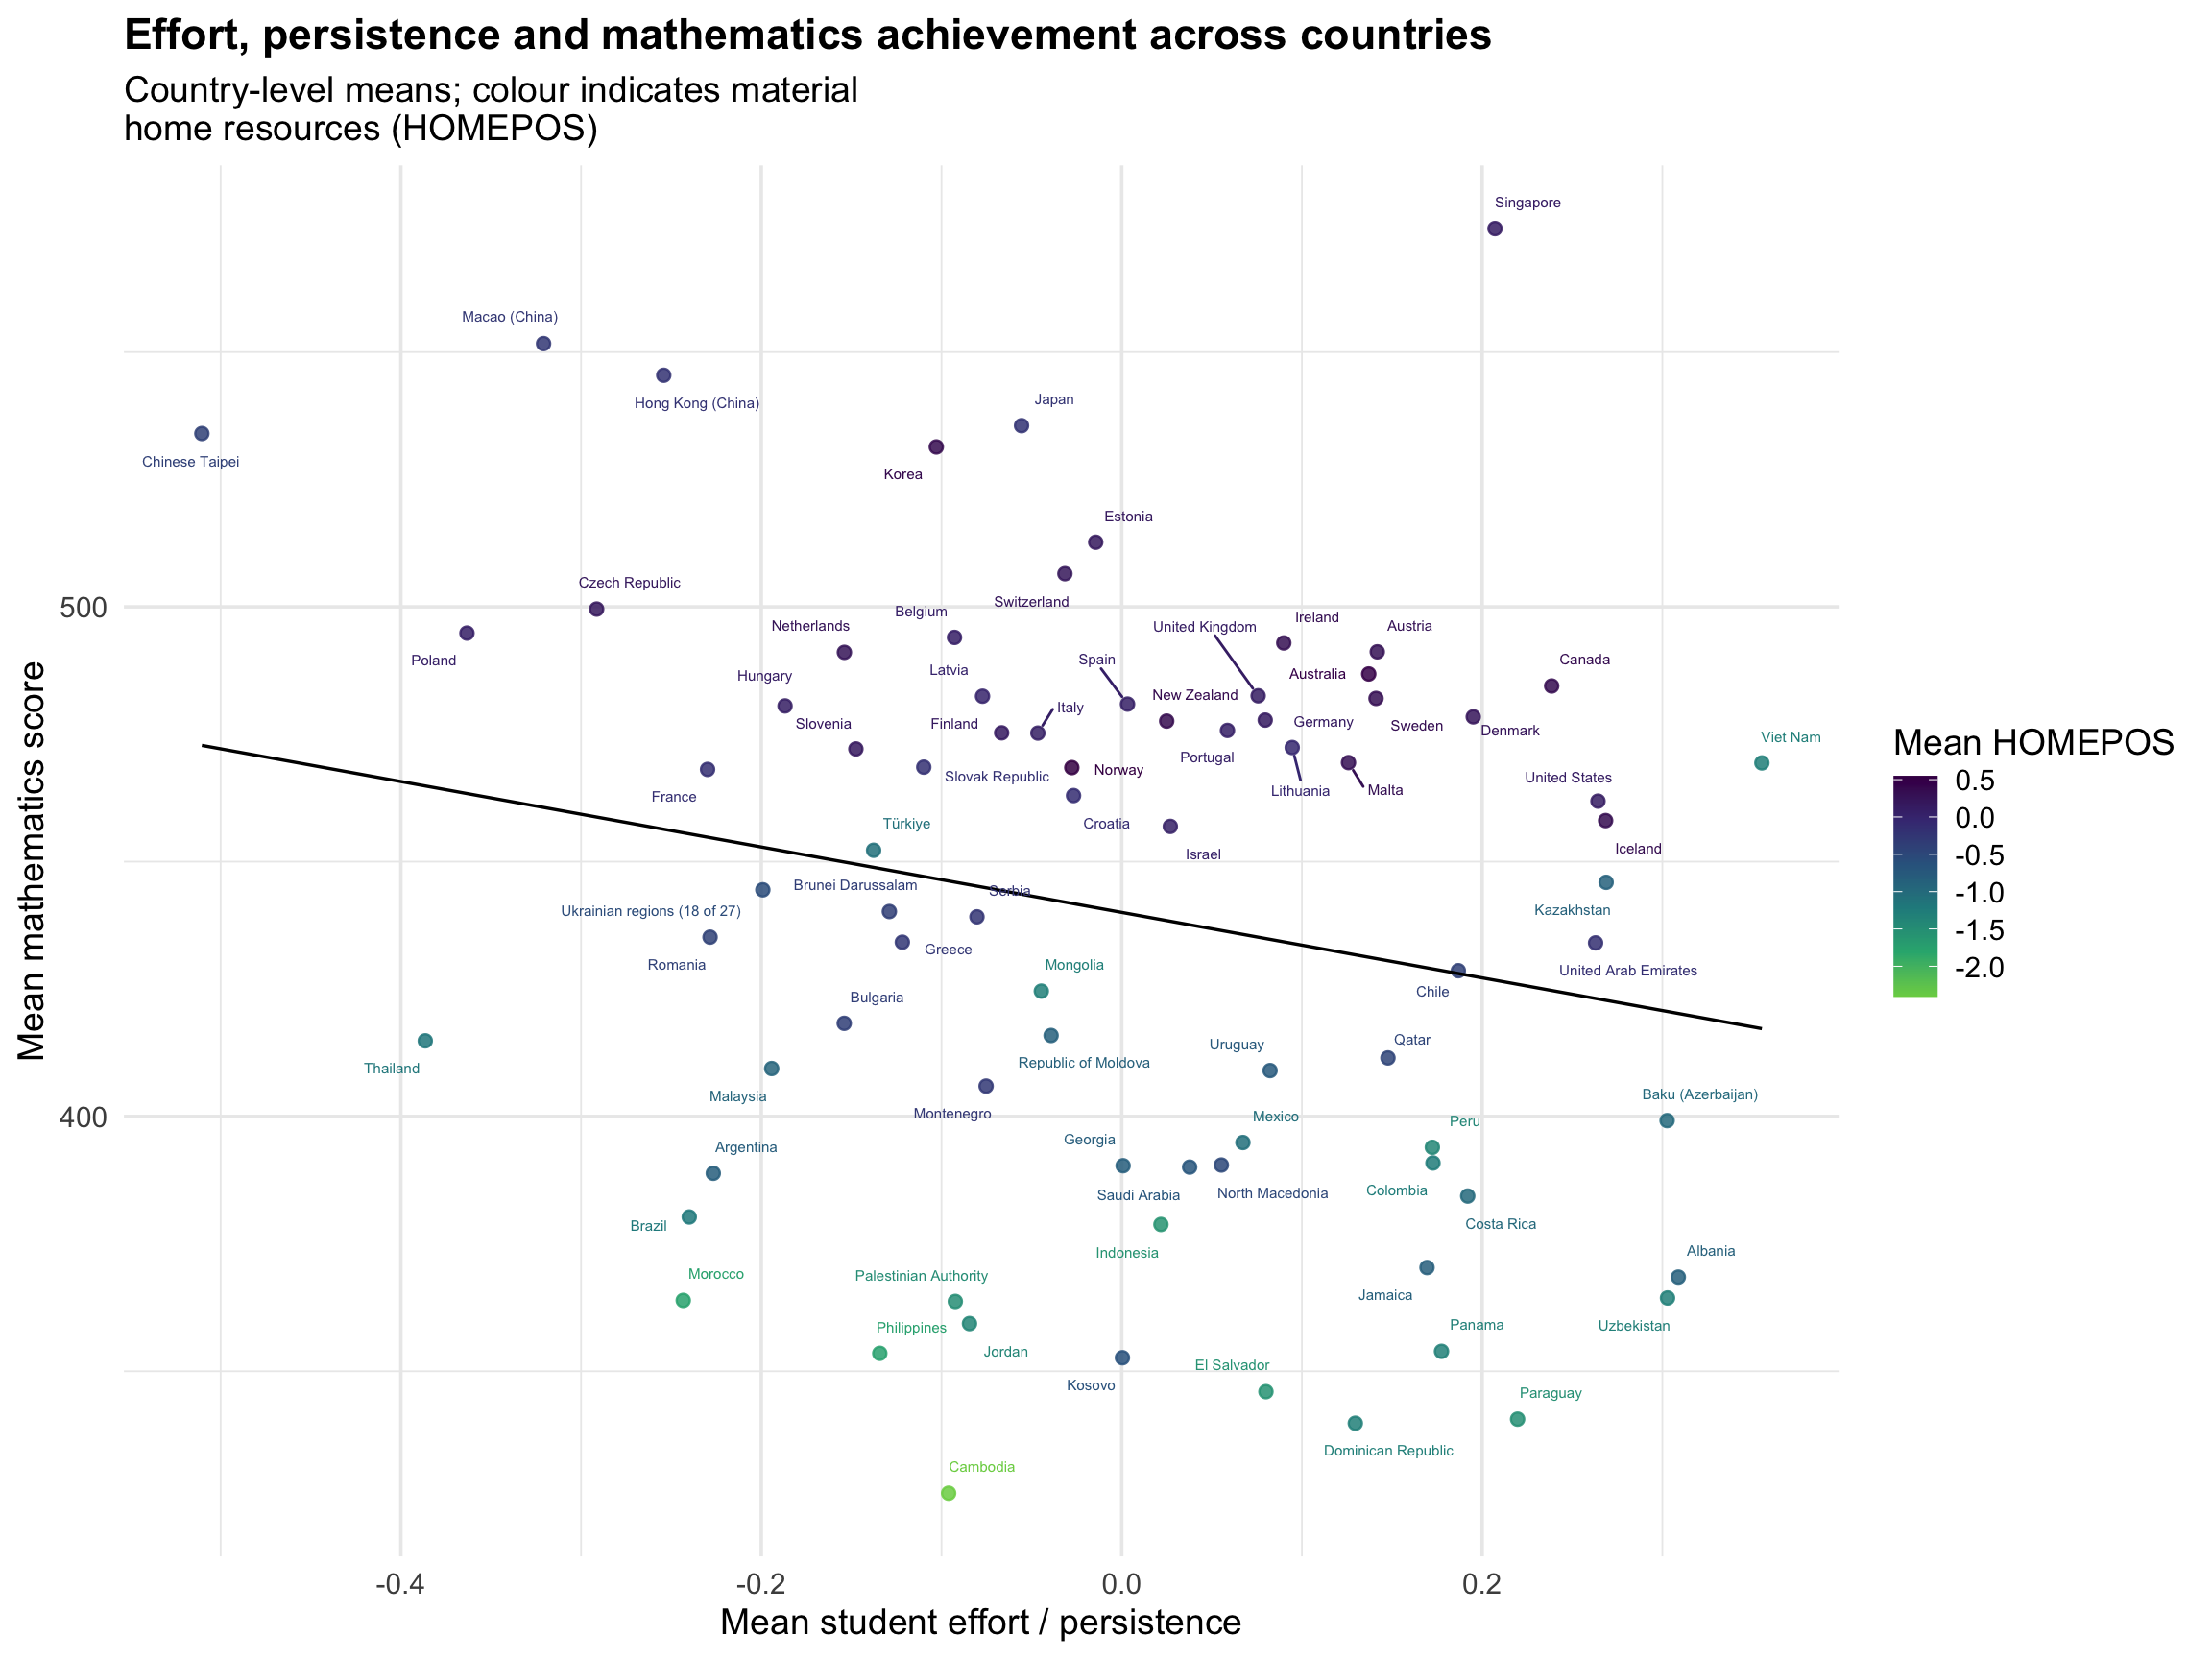
These patterns suggest that wealth and resources have a stronger influence on average maths achievement than reported effort, but self-reporting is tricky to interpret. Cultural differences play a role: Eastern countries tend to understate effort whilst Western countries are more likely to overstate it. This raises important questions about how we measure “hard work” and what it really predicts. While effort matters, it’s clear that national context (resources, cultural attitudes, and opportunity) shapes achievement in ways that simple self-reports can’t fully capture.